Debugging
XPyCode includes a full-featured debugger that lets you pause code execution, inspect variables, step through code line by line, and diagnose issues efficiently.
Overview
The debugger provides:
- Breakpoints - Pause execution at specific lines
- Step Controls - Execute code one line/function at a time
- Variable Inspection - View current variable values
- Call Stack - See the execution path
- Watch Expressions - Monitor custom expressions
- Debug Console - Evaluate expressions during debugging
Breakpoints
Setting Breakpoints
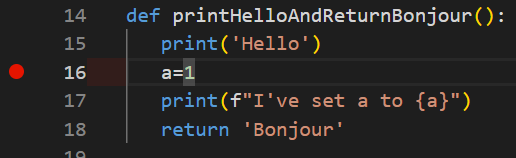
Add a breakpoint to pause execution:
Method 1: Keyboard Shortcut
Place cursor on a line and press F9:
- Toggles breakpoint on/off
Method 2: Debug Menu
Place cursor on a line and menu Debug → Toggle Breakpoint
Breakpoint Lines
Set breakpoints on executable lines (not on comments, blank lines, or decorators). The debugger may adjust the position slightly.
Managing Breakpoints
Remove a Breakpoint
- Menu Debug → Toggle Breakpoint
- Or press F9 on that line
Starting a Debug Session
Start Debugging
Run code in debug mode:
Method 1: Keyboard
Press Shift+F5
Method 2: Toolbar
Click the Debug button (🐛) in the toolbar
Method 3: Menu
Debug → Start Debugging
What Happens
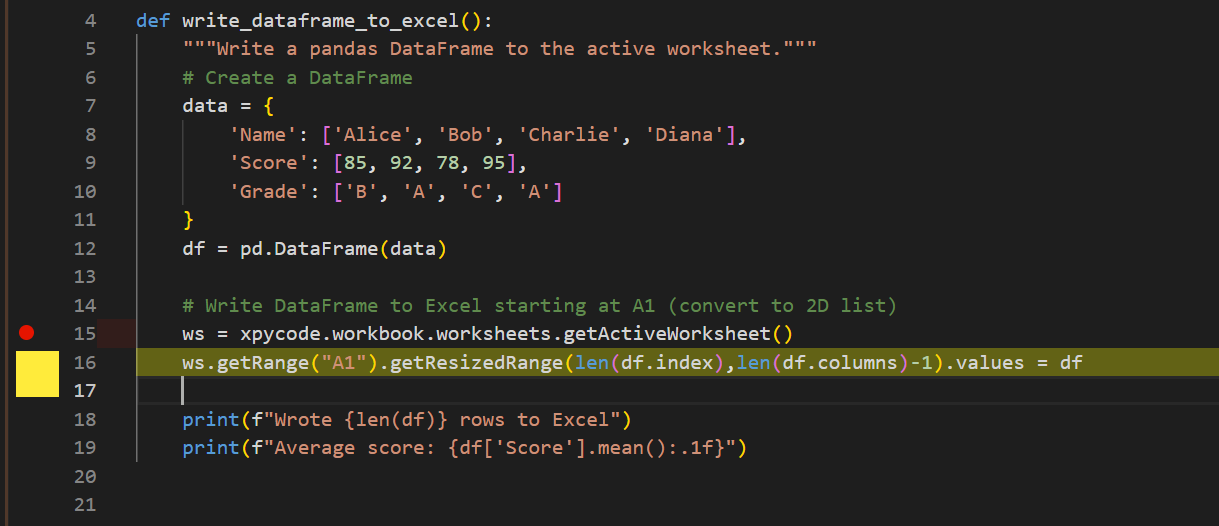
When debugging starts:
- Code executes normally until it hits a breakpoint
- Execution pauses at the breakpoint
- The Debug Panel appears at the bottom
- The current line is highlighted in yellow
- Variables panel shows current values
- Debug controls become active
Step Controls
Once paused at a breakpoint, control execution with these commands:
Continue (Shift+F5)
Resume execution until:
- Next breakpoint is hit
- Code completes
- An error occurs
Use when: You want to skip to the next breakpoint.
Step Over (F10)
Execute the current line and move to the next line:
- Functions - Executes the entire function (doesn't step inside)
- Simple statements - Executes and moves to next line
Use when: You want to stay at the current level and don't care about function internals.
Step Into (F11)
Step into function calls:
- Function calls - Enters the function and pauses on first line
- Simple statements - Same as Step Over
Use when: You want to debug inside a function being called.
def calculate(x):  # Step Into goes here
    return x * 2

def main():
    result = calculate(5)  # Paused here, press F11
    return f'The result is: {result}'
Stepping Limitations
The debugger only steps into pure XPyCode in-memory modules. Stepping into an external module function will behave like a step over.
Step Out (Shift+F11)
Finish the current function and return to the caller:
- Executes remaining lines in current function
- Pauses at the line after the function call
Use when: You've seen enough of the current function and want to return to the caller.
def helper():
    x = 1  # Currently paused here
    y = 2  # Press Shift+F11
    return x + y  # Executes this

result = helper()  # Pauses here after Step Out
Stop Debugging
End the debug session:
- Debug → Stop Debugging
- Or click the Stop button
Code execution halts immediately.
Variables Panel
The Variables panel shows all variables in the current scope:
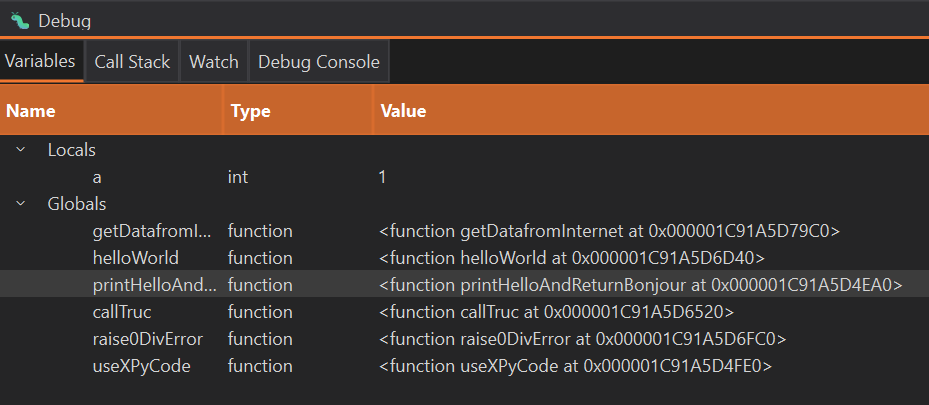
What's Displayed
- Local variables - Variables in the current function
- Global variables - Global variables in the current context
Variable Information
For each variable, you see:
- Name - Variable identifier
- Type - Data type (
int,str,list, etc.) - Value - Current value (truncated if very long)
Watch Expressions
Monitor custom expressions that update during debugging:
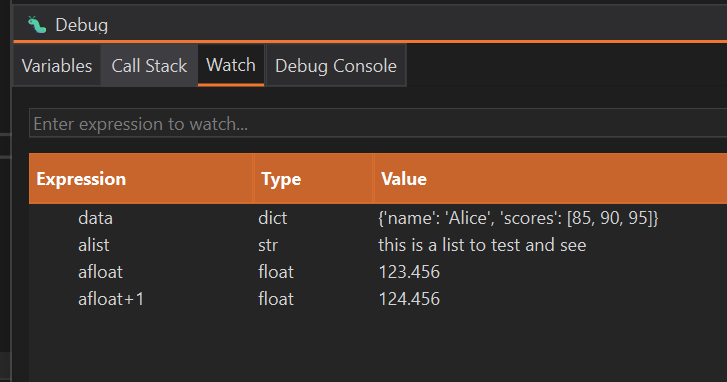
Adding Watch Expressions
- Open the Watch panel (in Debug Panel)
- Click Add or press Enter
- Enter a Python expression
- Press Enter
Examples:
# Watch simple variables
x + y

# Watch computations
len(data) * 2

# Watch attributes
user.name

# Watch function calls
calculate_total(items)

# Watch conditions
balance > 1000
Updating Watch Values
Watch expressions update automatically after each step:
- Step Over - Updates watches
- Step Into - Updates watches
- Step Out - Updates watches
Call Stack
The Call Stack shows the execution path—how you got to the current line:
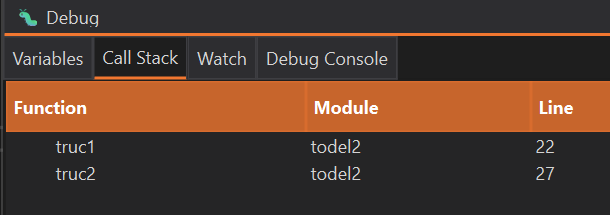
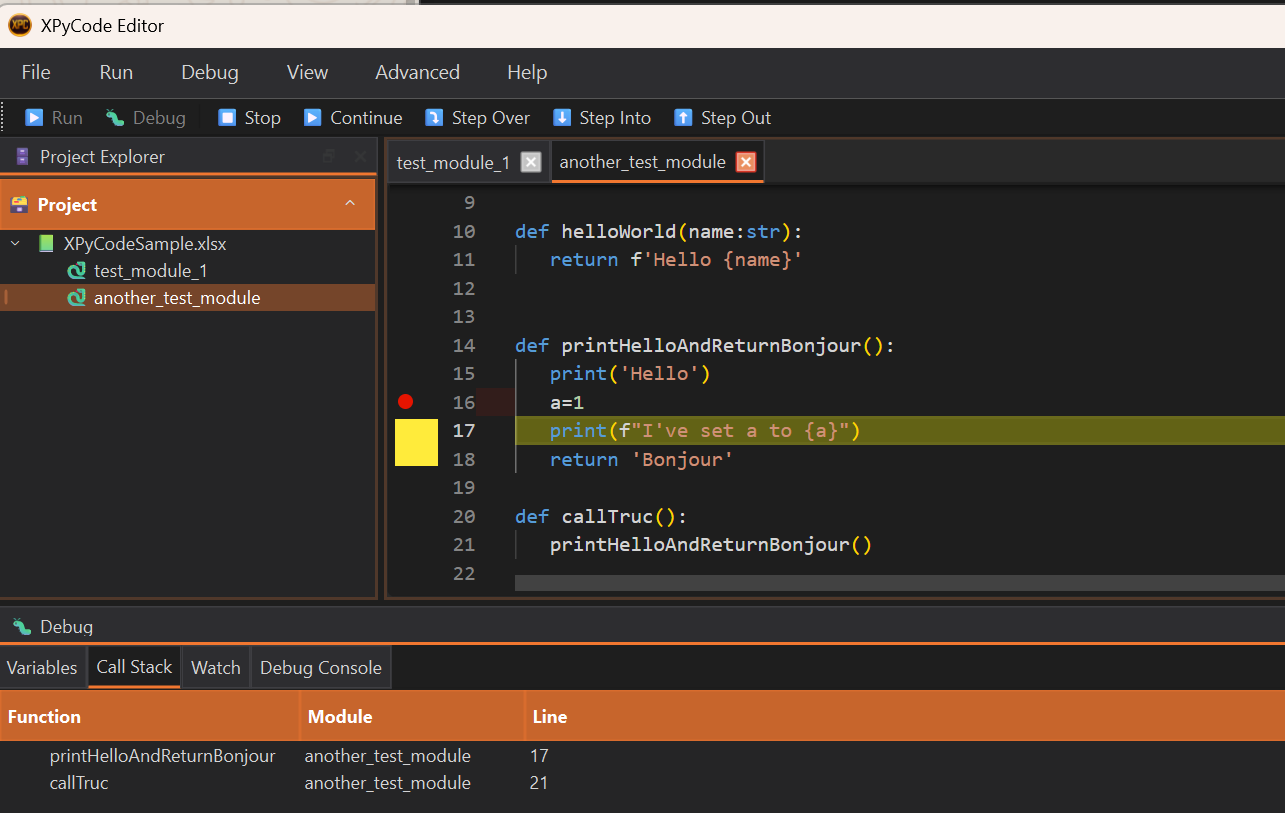
Reading the Call Stack
From top to bottom:
- Top - Current function (where execution is paused)
- Middle - Functions that called the current function
- Bottom - The entry point (usually module level)
Example:
my_function() at line 42    ← Currently here
calculate() at line 30      ← Called my_function
process_data() at line 15   ← Called calculate
<module> at line 5          ← Entry point
Navigating the Stack
Click on a stack frame to:
- View that function's code
- See local variables at that level
- Understand the calling context
Stack Navigation
Clicking a lower stack frame doesn't change execution—it just shows you that frame's state.
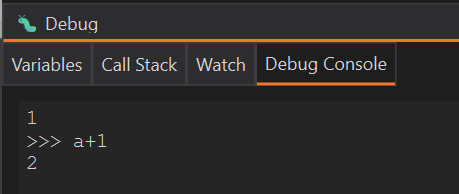
Debug Console
Execute Python expressions in the current debug context:
Using Debug Console
- Pause at a breakpoint
- Open the Debug Console tab (in Debug Panel)
- Type Python code
- Press Enter to execute
What You Can Do
Inspect Variables
Evaluate Expressions
Call Functions
Debug Console Limitations
The debug console operates in evaluation mode and cannot change variable values. It is a pure eval(), not exec(). Variable modification may be supported in future versions.
Troubleshooting
Breakpoint Not Hitting
Problem: Code doesn't pause at breakpoint
Solutions:
- Verify breakpoint is on an executable line (not comment/blank)
- Ensure code path reaches that line
- Check if using Debug mode (Shift+F5), not Run (F5)
- Remove and re-add the breakpoint
Variables Not Showing
Problem: Variables panel is empty
Solutions:
- Ensure execution is paused (not running)
- Check if variables exist in current scope
- Step Into a function to see its local variables
Step Controls Not Working
Problem: F10/F11 don't step
Solutions:
- Verify you're in an active debug session
- Check if code is paused (not running)
- Look for keyboard shortcut conflicts
Debug Console Not Evaluating
Problem: Expressions don't execute
Solutions:
- Ensure execution is paused at a breakpoint
- Check syntax (must be valid Python)
- Verify variable names are correct
Next Steps
-
Console
Learn to use console output for debugging.
-
Editor
Master editor features to write better code.
-
Troubleshooting
Solutions to common debugging issues.
Master Debugging
The debugger is one of the most powerful tools for understanding and fixing code. Practice using it regularly to become proficient.